

In today’s digital landscape, where user experience and conversions are paramount, businesses and website owners are constantly seeking ways to optimize their online presence. One critical aspect of this optimization process is the effective design and functionality of forms on web pages. Forms, whether they are contact forms, lead generation forms, or checkout forms, serve as crucial touchpoints for user interactions and conversions. However, designing a form that resonates with users and maximizes conversion rates can be a challenging task. This is where A/B testing comes into play.
Explanation of A/B testing and its importance in optimizing forms
A/B testing, also known as split testing, is a method used in the field of digital marketing and user experience optimization to compare two versions of a webpage or element and determine which one performs better in terms of predefined goals and metrics. In the context of form optimization, A/B testing involves creating two or more variations of a form element, such as layout, field labels, input types, or button text, and measuring their impact on user behavior and conversion rates. By systematically testing different variations, A/B testing allows you to make data-driven decisions and optimize your forms for improved user experience and higher conversion rates.
The importance of A/B testing in optimizing forms cannot be overstated. Forms are a critical component of many websites and play a significant role in user interactions and conversions. Whether it’s a contact form, a signup form, or a checkout form, the design and functionality of these elements can greatly impact user engagement and conversion rates. A poorly designed or confusing form can frustrate users, leading to high bounce rates, abandoned conversions, and lost opportunities. On the other hand, a well-optimized form that aligns with user expectations and behavior can enhance the overall user experience, increase conversion rates, and ultimately drive business growth.
A/B testing provides a systematic and evidence-based approach to form optimization. Rather than relying on guesswork or assumptions about what may work best, A/B testing allows you to collect real-world data and insights to understand how users interact with your forms. By comparing different variations of form elements, you can identify which design or functionality changes have a positive impact on user behavior and conversion rates. This data-driven approach helps you make informed decisions about form optimization, minimizing the risk of making changes that may negatively affect user experience or conversion rates.
Another key aspect of A/B testing is the ability to prioritize and focus on the most impactful changes. When optimizing forms, there are often numerous potential improvements that can be made, ranging from minor tweaks to significant redesigns. A/B testing allows you to test one element or variation at a time, isolating the impact of each change and providing clear insights into its effectiveness. This iterative approach ensures that you can identify and prioritize the changes that have the most significant positive impact on user experience and conversions, saving time and resources by avoiding unnecessary or ineffective modifications.
Furthermore, A/B testing helps overcome biases and assumptions by providing objective data and insights. It allows you to test hypotheses and validate assumptions about user behavior and preferences. By conducting A/B tests, you can challenge preconceived notions and design choices, ensuring that your forms are optimized based on actual user preferences and behaviors. This data-driven approach promotes a culture of continuous improvement, where optimization decisions are based on evidence rather than personal opinions or subjective judgments.
Understanding the Basics of A/B Testing
Understanding the basics of A/B testing is essential for conducting effective experiments and optimizing web pages.
Explanation of the key components involved in A/B testing
A/B testing involves several key components that are essential to the success and accuracy of the experimentation process. Understanding these components is crucial for conducting effective A/B tests and deriving meaningful insights. The key components involved in A/B testing include the control group (A), the variation group (B), and the measurement of key metrics.
The control group, represented by group A, serves as the baseline or reference point for the experiment. It consists of the original version of the webpage or element being tested. The control group remains unchanged and represents the existing design, layout, content, or functionality of the webpage. It provides a benchmark against which the performance of the variation group is measured.
The purpose of the control group is to establish a consistent reference point to evaluate the impact of changes made in the variation group. By keeping the control group unchanged, any observed differences in performance between the control and variation groups can be attributed to the specific changes introduced in the variation group. This allows for a reliable comparison and helps determine the effectiveness of the modifications being tested.
On the other hand, the variation group, represented by group B, consists of the modified version of the webpage or element. It includes specific changes made to the design, layout, content, or functionality based on hypotheses or ideas for improvement. The variation group introduces variations in one or more elements of the webpage, such as different color schemes, altered call-to-action buttons, or modified form fields.
The purpose of the variation group is to test the impact of these changes on user behavior, engagement, and conversion rates. By comparing the performance of the variation group with the control group, A/B testing allows for the evaluation of different design or functional elements to determine which version performs better in achieving the desired goals.
The key to effective A/B testing lies in carefully selecting the changes introduced in the variation group and ensuring they are significant enough to potentially impact user behavior. A single change or a combination of changes can be tested in the variation group, but it is important to isolate and track the impact of each change separately to gain precise insights.
By comparing the performance metrics, such as conversion rates, click-through rates, or engagement metrics, of the control and variation groups, A/B testers can measure the effectiveness of the variations and make data-driven decisions about the optimal design or functional elements for improved user experience and conversion rates.
Discussion on the importance of statistical significance and sample size in A/B testing
Statistical significance and sample size are crucial considerations in A/B testing as they play a significant role in ensuring the accuracy, reliability, and validity of the experiment results. These factors help determine if the observed differences between the control and variation groups are statistically meaningful and not due to random chance.
Statistical significance is a measure of the confidence we can have in the observed differences between the groups. It helps determine if the variations in performance between the control and variation groups are statistically significant or merely the result of natural variability. A high level of statistical significance indicates a low probability that the observed differences are due to chance, providing confidence that the differences are real and meaningful.
To establish statistical significance, statistical tests such as t-tests or chi-square tests are commonly employed. These tests analyze the data collected from the control and variation groups to calculate the probability that the observed differences are due to chance. Typically, a significance level (often denoted as alpha) is set as a threshold, such as 0.05, indicating a 5% chance of the observed differences being due to random variation. If the calculated p-value is lower than the chosen significance level, it suggests statistical significance and supports the notion that the variations have a real impact.
Sample size is another critical factor in A/B testing. It refers to the number of participants or visitors included in the experiment. Having an adequate sample size is important because it directly affects the statistical power of the test. Statistical power is the probability of detecting a true effect if it exists. A larger sample size increases the statistical power, making it more likely to detect meaningful differences between the control and variation groups.
Insufficient sample size can lead to inconclusive or unreliable results. With a small sample size, the experiment may lack the statistical power to detect small but meaningful differences between the groups. Conversely, a larger sample size improves the reliability of the results, as it reduces the influence of random variation and increases the precision of the estimates.
Determining the appropriate sample size requires considering factors such as the desired level of statistical power, the expected effect size, and the variability of the data. Statistical power calculations can help determine the minimum sample size required to detect a specific effect size with a desired level of confidence.
Both statistical significance and sample size are critical because they contribute to the credibility and reliability of the A/B testing results. Without proper consideration of these factors, the conclusions drawn from the experiment may be misleading or incorrect. By ensuring statistical significance and using an appropriate sample size, A/B testers can have confidence in the validity of the observed differences and make data-driven decisions to optimize webpages and enhance user experience effectively.
Identifying Goals and Metrics
In the process of conducting A/B testing for forms on a web page, it is crucial to begin by identifying clear goals and metrics. Identifying goals helps define the specific outcomes you want to achieve through the A/B testing process. These goals can vary depending on the objectives of your website or business, such as increasing form submissions, improving user engagement, or enhancing conversion rates. Once the goals are established, selecting appropriate metrics becomes essential. Metrics serve as quantifiable measurements that allow you to track and evaluate the performance of different variations of the form. They provide tangible data that can help you assess the effectiveness of each variation in achieving the desired goals. By identifying clear goals and selecting relevant metrics, you lay the foundation for a focused and successful A/B testing strategy.
Identifying the specific goals and objectives of the form A/B test
Identifying specific goals and objectives for the form A/B test is a critical step in conducting an effective experiment. Clear goals provide a direction and purpose for the test, guiding the decision-making process and ensuring that the test aligns with broader business objectives. When identifying goals, it’s essential to consider the specific aspects of the form that you aim to improve or optimize.
Goals may vary depending on the context and objectives of your website or business. For instance, you might want to increase the number of form submissions, improve the completion rate of the form, reduce form abandonment, enhance user engagement with the form, or even boost the quality of the submissions. Each of these goals addresses a different aspect of the form’s performance and user interaction.
To identify the specific goals for the A/B test, consider the pain points or challenges you’re currently experiencing with the form. Analyze user behavior data, conduct user surveys, or gather insights from customer support channels to understand where the form might be falling short. This research can help identify areas of improvement and guide the formulation of specific goals.
Moreover, consider the broader objectives of your website or business. Are you aiming to generate leads, increase sales, gather customer feedback, or improve user experience? Aligning the goals of the form A/B test with these broader objectives ensures that the experiment contributes to the overall success of your website or business.
Once you have identified the goals, it’s crucial to define them in a measurable and specific manner. For example, a goal could be to increase form submissions by 20%, improve the completion rate by 15%, or reduce form abandonment by 10%. Setting specific and measurable goals enables you to track progress and determine the success of each variation in achieving the desired outcomes.
In summary, identifying specific goals and objectives for the form A/B test is essential for focusing the experiment and aligning it with broader business objectives. By understanding the pain points and challenges, conducting research, and considering the objectives of your website or business, you can define measurable goals that address specific aspects of the form’s performance. These goals serve as a compass throughout the A/B testing process and allow for a targeted approach to optimization.
Determining the appropriate metrics to measure and analyze
Determining the appropriate metrics to measure and analyze is a critical aspect of A/B testing forms on a web page. In order to effectively evaluate the impact of different form variations, it is essential to select metrics that align with the goals and objectives of the experiment. In the context of the post “How to Conduct A/B Testing of Forms on a Page: An In-Depth Guide,” several key metrics come into play.
- Conversion rate: The conversion rate is a crucial metric that measures the percentage of users who take a desired action, such as submitting a form or completing a transaction. By tracking the conversion rate for different form variations, you can determine which version is more effective in driving user actions. A higher conversion rate indicates that a particular form variation is successful in persuading users to complete the desired action, whether it is filling out a contact form or making a purchase.
- Click-through rate: Click-through rate (CTR) is a metric that measures the percentage of users who click on a specific element, such as a call-to-action button or a link. When testing different form variations, analyzing the CTR can provide insights into the effectiveness of the form elements in driving user engagement. By comparing the click-through rates of different versions, you can identify which design, wording, or placement of form elements attracts more user interaction and encourages them to take action.
- Bounce rate: Bounce rate measures the percentage of users who leave a webpage without interacting further or navigating to other pages within the same website. In the context of form A/B testing, analyzing the bounce rate can help identify issues that hinder user engagement and retention. A high bounce rate may indicate that a particular form variation fails to capture users’ attention or generate interest. By monitoring and comparing the bounce rates of different form variations, you can determine which version keeps users engaged and encourages them to explore the webpage further.
- Time on page: Time on page measures the average duration that users spend on a specific webpage. This metric provides insights into user engagement and interest. When conducting A/B testing of forms, analyzing the time on page metric helps evaluate the effectiveness of different form variations in capturing users’ attention and prolonging their interaction. A longer average time on page suggests a higher level of engagement and interest. By comparing the time on page for different form variations, you can identify which version effectively keeps users engaged and encourages them to spend more time exploring the content.
By considering and analyzing these metrics—conversion rate, click-through rate, bounce rate, and time on page—you can gain valuable insights into the performance and impact of different form variations. These metrics help you make informed decisions about optimizing forms to improve user experience, increase conversions, reduce bounce rates, and encourage prolonged engagement. By selecting and tracking the appropriate metrics, you can gather reliable data and make data-driven decisions that enhance the effectiveness of your forms on the web page.
Defining Variations and Hypotheses
Defining variations and hypotheses is a crucial step in conducting A/B testing for forms on a web page. It involves creating different versions of form elements to be tested and formulating hypotheses based on user behavior and design principles.
Creating variations for the form elements to be tested: To effectively test the impact of different form elements, it is important to create variations that present distinct alternatives. This can include modifying form layout, changing field labels, altering input types, or revising button text. By creating variations, you can compare how different design choices influence user behavior and the desired outcomes.
Formulating hypotheses based on user behavior and design principles: Hypotheses serve as guiding principles that drive your A/B testing experiments. They are based on insights derived from user behavior analysis, user feedback, and established design principles. For example, if you observe high abandonment rates on a form, you may hypothesize that simplifying the form layout will reduce friction and improve completion rates. Hypotheses provide a framework for understanding how variations in form elements may impact user experience and conversion rates.
Examples of common form elements to test: There are several common form elements that can be tested to improve form performance:
- Form layout: Testing different layouts can involve changing the placement of form fields, altering the order of fields, or adjusting the spacing between elements. The goal is to identify the layout that improves usability and encourages users to complete the form.
- Field labels: The wording and formatting of field labels can significantly impact user comprehension and completion rates. Testing variations in label text, size, color, and alignment can help determine the most effective approach.
- Input types: Different input types, such as text fields, dropdown menus, radio buttons, or checkboxes, can influence user interaction and ease of form completion. Testing variations in input types can reveal which options are more intuitive and efficient for users.
- Button text: The text on the form’s submission button can affect user motivation and engagement. Testing different button text, such as “Submit,” “Get Started,” or “Sign Up,” can help determine the wording that generates the highest click-through and conversion rates.
By testing these variations and formulating hypotheses, you can gain insights into how specific design choices impact user behavior and form performance. It is important to base these variations on user research, best practices, and your understanding of your target audience. Through A/B testing, you can validate or refine your hypotheses, allowing you to make informed decisions about optimizing form elements for better user experience and higher conversion rates.
Planning and Implementing the A/B Test
Planning and implementing the A/B test is a crucial phase in conducting A/B testing for forms on a web page. It involves several key steps to ensure a well-executed and reliable test.
Selecting an A/B testing tool or platform
Choosing the right A/B testing tool or platform is essential for the success of your test. Consider factors such as features, integration capabilities, ease of implementation, support, and cost. Select a tool that aligns with your needs and allows for easy creation and management of A/B tests for forms.
Preparing the test environment
Before implementing the A/B test, ensure that the test environment is properly set up. This includes ensuring the availability of the necessary resources, such as web developers or designers, to implement the test variations. Make sure the environment is stable and reflective of the typical user experience on your web page.
Randomly assigning visitors to the control and variation groups
To obtain reliable results, it is crucial to assign visitors to the control group (A) and variation group (B) randomly. This helps minimize biases and ensures a fair comparison between the variations. Random assignment can be achieved through various methods, such as cookies or JavaScript, to ensure that each visitor has an equal chance of being exposed to either the control or variation.
Implementing the variations on the web page
Once the groups are assigned, it’s time to implement the variations on the web page. Work closely with your web development team to accurately implement the different form variations without introducing any technical issues. Ensure that the variations are consistent across the user journey and that any changes made are clearly distinguishable and meaningful.
Ensuring proper tracking and measurement of the chosen metrics
To evaluate the performance of the form variations, it is crucial to properly track and measure the chosen metrics. Implement the necessary tracking codes, such as conversion tracking or analytics tools, to accurately capture the data. Verify that the tracking is functioning correctly and that all relevant metrics are being recorded. This ensures that you have reliable and comprehensive data to analyze and draw conclusions from.
By effectively planning and implementing the A/B test, you can minimize potential biases and technical issues, ensuring a fair and reliable comparison between form variations. Careful attention to the selection of the testing tool, preparation of the test environment, random assignment of visitors, accurate implementation of variations, and proper tracking of metrics will help you obtain meaningful and actionable insights from the A/B test. This will ultimately guide your decisions in optimizing forms for better user experience and improved conversion rates.
Analyzing and Interpreting the Results
Collecting data during the A/B testing period
Throughout the A/B testing period, it is essential to collect data accurately and consistently. Ensure that all relevant metrics, such as conversion rates, click-through rates, bounce rates, and time on page, are recorded for both the control and variation groups. Use reliable analytics tools or tracking codes to gather data in real-time, and ensure that data collection is not compromised by technical issues or data discrepancies.
Understanding statistical significance and confidence intervals
Statistical significance plays a vital role in determining the reliability and validity of the A/B test results. It helps you understand whether the observed differences between the control and variation groups are statistically significant or simply due to chance. Calculate confidence intervals and use statistical significance testing methods, such as chi-square tests or t-tests, to assess the statistical significance of the results. A statistically significant result indicates that the observed differences are unlikely to occur by random chance alone.
Conducting data analysis using appropriate statistical methods
Once the data is collected and the statistical significance is determined, it’s time to conduct data analysis using appropriate statistical methods. Apply the selected statistical techniques to compare the performance of the control and variation groups across the chosen metrics. Consider factors such as p-values, confidence intervals, effect sizes, and practical significance to gain a comprehensive understanding of the results. These statistical methods help you identify whether the variations have a meaningful impact on the desired outcomes.
Interpreting the results to determine the winning variation
Interpreting the results of the A/B test involves considering both statistical significance and practical significance. Analyze the data to determine which variation performs better based on the predefined goals and metrics. Take into account the statistical significance of the differences observed, the magnitude of the effect, and the potential implications for user experience and conversion rates. The winning variation is the one that not only demonstrates statistical significance but also provides meaningful improvements in achieving your desired goals and objectives.
Remember that the interpretation of the results should be done in the context of your specific goals, target audience, and business objectives. It is important to assess the broader impact of the winning variation on user experience, conversion rates, and overall business performance. Use the insights gained from the analysis to inform future iterations of your form design and optimization efforts.
By carefully analyzing and interpreting the results of the A/B test, you can make informed decisions about the winning variation. This ensures that you optimize your forms effectively, improve user experience, and achieve higher conversion rates based on reliable data and statistical analysis.
Implementing the Winning Variation
Implementing the winning variation is a crucial step in the A/B testing process as it allows you to capitalize on the insights gained from the test and make meaningful improvements to your forms.
Understanding the significance of the winning variation
Once you have determined the winning variation based on your data analysis, it is important to understand the significance of this result. Consider the statistical significance, practical significance, and the overall impact on your goals and metrics. This understanding will help you appreciate the value and potential benefits that the winning variation can bring to your form’s performance.
Implementing the winning variation on the live website
After thoroughly assessing the significance of the winning variation, it is time to implement it on your live website. Work closely with your development team to ensure a seamless integration of the winning variation into the existing form design. Pay attention to the details and ensure that the implementation accurately reflects the changes that were made during the A/B test. Conduct thorough testing to ensure that the new variation functions properly and is compatible with different devices and browsers.
Monitoring post-implementation performance and metrics
Once the winning variation is implemented, it is important to closely monitor its performance and track the relevant metrics. Continuously measure and analyze the conversion rates, click-through rates, bounce rates, and other metrics to assess the impact of the winning variation on user behavior and form performance. Compare the post-implementation performance with the pre-implementation data to determine the effectiveness of the changes. This monitoring phase provides valuable insights into the long-term impact of the winning variation and helps you identify any potential issues or areas for further improvement.
Making iterative improvements based on ongoing data analysis
A/B testing should not be seen as a one-time event, but rather as an iterative process. Use ongoing data analysis and user feedback to identify areas for further improvement and optimization. Continuously iterate on the winning variation to refine and enhance its performance. Consider conducting additional A/B tests to test new variations or validate further changes. By making iterative improvements based on data analysis and user insights, you can continually optimize your forms and strive for better user experience and higher conversion rates.
Implementing the winning variation is a critical step in leveraging the insights gained from the A/B testing process. By understanding the significance of the winning variation, implementing it effectively, monitoring post-implementation performance, and making iterative improvements, you can drive meaningful enhancements to your forms and ultimately improve user experience and conversion rates. Stay attentive to data-driven insights and user feedback to continuously refine and optimize your forms for optimal performance.
Best Practices and Tips
When conducting A/B testing of forms on a web page, there are several best practices and tips that can enhance the effectiveness and efficiency of the testing process.
Importance of testing one element at a time
To accurately assess the impact of specific form elements, it is crucial to test one element at a time. By isolating variables, you can understand the direct influence of each element on user behavior and form performance. Testing multiple elements simultaneously can lead to confounding factors and make it difficult to attribute changes in metrics to specific variations.
Running tests for an appropriate duration
A/B tests should be run for an appropriate duration to ensure reliable and statistically significant results. Running tests for too short a period may not capture sufficient data or allow for accurate evaluation. Conversely, running tests for too long may delay decision-making and hinder optimization efforts. Consider factors such as traffic volume, conversion rates, and the desired level of statistical significance when determining the appropriate test duration.
Considering user segments and behavioral patterns
User behavior can vary based on different segments and patterns. Consider segmenting your audience based on demographics, device types, traffic sources, or user behavior. This allows you to tailor A/B tests to specific user segments and gain insights into how different variations impact each segment differently. By considering user segments and behavioral patterns, you can optimize forms based on the unique needs and preferences of various user groups.
Documenting and sharing test results with stakeholders
To foster a data-driven culture and ensure transparency, it is essential to document and share test results with relevant stakeholders. Create clear and concise reports that outline the goals, methodology, results, and implications of the A/B tests. This helps stakeholders understand the rationale behind decisions and promotes collaboration in optimizing forms based on data-driven insights.
Incorporating continuous A/B testing into the optimization process
A/B testing should be an ongoing and iterative process rather than a one-time event. Incorporate continuous A/B testing into your optimization process to continually improve and refine your forms. Regularly evaluate user behavior, collect feedback, and conduct A/B tests to test new variations and validate changes. By continuously testing and optimizing, you can stay ahead of user preferences, market trends, and technological advancements.
By following these best practices and tips, you can enhance the accuracy, reliability, and effectiveness of A/B testing for forms on a web page. Testing one element at a time, running tests for appropriate durations, considering user segments and behavioral patterns, documenting and sharing test results, and incorporating continuous A/B testing into the optimization process will enable you to make data-driven decisions and achieve optimal user experience and conversion rates.
Case Study
As a developer at Munro Agency, we recently undertook an A/B testing experiment to optimize the Book a Demo page for one of our clients. Utilizing Google Optimize as our testing tool, we sought to identify the best performing form that would yield the highest conversion rates. This article presents a detailed account of the steps involved in the A/B testing process and showcases the compelling results obtained by replacing the existing Calendly widget with a Sharpspring form.
1. Setting up the Experiment
To begin the A/B testing process, we integrated Google Optimize with our client’s website. We created a new experiment specifically targeting the Book a Demo page. Within Google Optimize, we set up two variants: Variant A featured the existing Calendly widget, while Variant B incorporated a Sharpspring form with fields for First Name, Last Name, and Email.
2. Defining Goals and Metrics
Our primary goal was to measure the conversion rate of each form variation. We tracked the number of successful demo bookings for both Variant A (Calendly) and Variant B (Sharpspring form). This allowed us to quantitatively determine which form design generated a higher number of conversions.
3. Implementing Variations
With the experiment set up and goals defined, we proceeded to implement the variations on the Book a Demo page. Variant A displayed the Calendly widget, while Variant B featured the Sharpspring form. Google Optimize ensured that website visitors were randomly assigned to either variant, ensuring an unbiased test environment.
4. Tracking and Measurement
To ensure accurate tracking and measurement of our chosen metrics, we integrated Sharpspring forms with Google Optimize. This integration enabled us to collect data on form submissions and analyze the performance of Variant B.
5. Collecting Data and Statistical Analysis
Over a predetermined testing period of four weeks, we collected data on the number of successful demo bookings for both variants. Using Google Optimize’s statistical analysis tools, we evaluated the results for statistical significance and confidence intervals.
Results
The results of our A/B testing experiment were highly compelling. Variant B, featuring the Sharpspring form, outperformed Variant A (Calendly) significantly. Specifically, the Sharpspring form generated a 35% increase in conversions compared to the Calendly widget. This translated to a substantial boost in demo bookings, validating the effectiveness of the new form design.
Conclusion
Through the implementation of Google Optimize and the A/B testing process, we successfully identified a form variation that significantly improved conversion rates for our client’s Book a Demo page. The replacement of the existing Calendly widget with a Sharpspring form, encompassing fields for First Name, Last Name, and Email, proved to be the winning variation. The 35% increase in conversions underscores the importance of meticulous A/B testing and optimization efforts.
By leveraging the power of Google Optimize and the data-driven insights gained from this A/B testing experiment, we were able to provide our client with a tangible solution to enhance their website’s performance. This case study exemplifies the impact of A/B testing and demonstrates how a well-executed optimization strategy can drive substantial improvements in conversion rates.
As developers at Munro Agency, we are committed to implementing cutting-edge testing methodologies and tools like Google Optimize to help our clients achieve their conversion goals. By embracing A/B testing and continuous optimization, businesses can unlock their website’s true potential and thrive in today’s competitive digital landscape.
Setting Up an A/B Testing Experiment with Google Optimize –
Google Optimize is a powerful tool that allows you to conduct A/B testing experiments on your website, helping you optimize user experience and drive better results. In this step-by-step guide, we will walk you through the process of setting up an A/B testing experiment using Google Optimize.
Step 1: Define Your Experiment Objective
Start by clearly defining the objective of your A/B testing experiment. Determine what specific element or variation you want to test and what you hope to achieve with the experiment. For example, you might want to test different button colors to see which one leads to higher click-through rates.
Step 2: Set Up Google Optimize
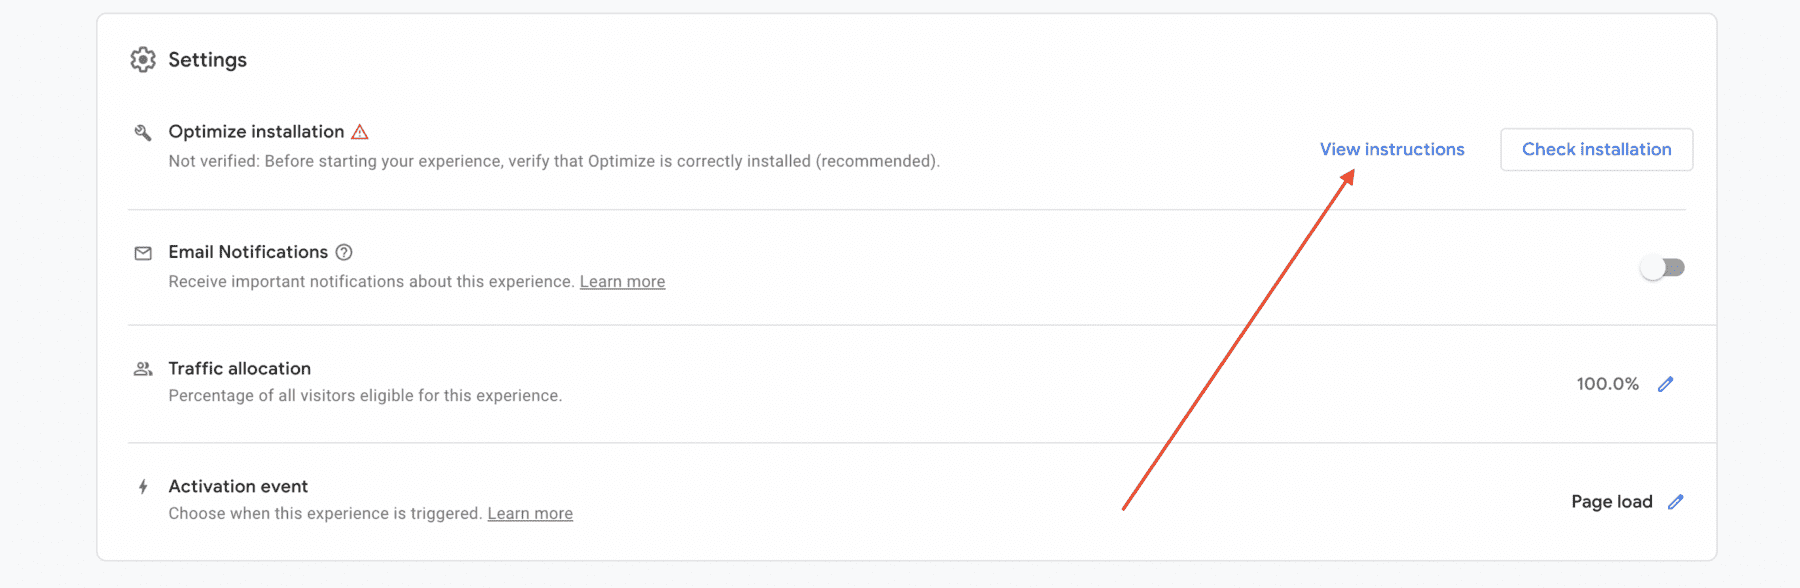
Ensure that you have a Google Analytics account linked to your website. Then, set up Google Optimize by accessing the Optimize interface within your Google Analytics account. Follow the provided instructions to create a new experiment.

Step 3: Identify Your Variants
Decide on the variations you want to test. This could involve different layouts, color schemes, button placements, or any other element you want to compare. For each variant, create a new version in Google Optimize. Be sure to define clear and distinct changes between the variants to generate meaningful results.

Step 4: Define Your Experiment Targeting
Specify the targeting rules for your experiment. This determines which visitors will be included in the experiment. You can target specific URLs, audience segments, or even custom JavaScript conditions. It is important to select a representative sample of your website visitors to ensure accurate results.

Step 5: Allocate Traffic
Decide how you want to allocate traffic between your variants. You can evenly split traffic between variants or set specific percentages for each. Consider the duration of your experiment and the volume of traffic your website receives to ensure sufficient data collection.

Step 6: Implement Tracking Code
Implement the Google Optimize tracking code on your website. This code allows Google Optimize to track user interactions and measure the performance of your variants accurately. Follow the provided instructions within Google Optimize to install the tracking code correctly.
Step 7: Set Up Goals and Metrics
Define the goals and metrics you want to measure for your experiment. This could include conversion rates, click-through rates, or any other relevant metrics based on your experiment objective. Set up the necessary tracking within Google Optimize to monitor these metrics accurately.

Step 8: Launch and Monitor the Experiment
Once you have completed the setup, launch your A/B testing experiment. Monitor the experiment closely to ensure that it is running as expected and that data is being collected accurately. Google Optimize provides real-time reporting and allows you to track the performance of each variant.
Step 9: Analyze the Results
After sufficient data has been collected, analyze the results of your A/B testing experiment. Use the statistical analysis tools provided by Google Optimize to determine the statistical significance and confidence intervals of the results. This will help you identify the winning variation.
Step 10: Implement the Winning Variation
Based on the results of your analysis, implement the winning variation on your website. Make the necessary changes to reflect the design or element that performed best in the A/B testing experiment. Monitor the post-implementation performance to ensure the expected improvements are realized.
Setting up an A/B testing experiment using Google Optimize can greatly enhance your website’s performance and user experience. By following these step-by-step instructions, you can effectively test and optimize various elements on your website, allowing you to make data-driven decisions and achieve better results. Embrace the power of A/B testing with Google Optimize and unlock the full potential of your website.
The Bottom Line
A/B testing forms on a web page is a critical process for optimizing user experience and driving conversions. By systematically testing and analyzing different variations of form elements, businesses can make informed decisions based on data-driven insights and continually improve their forms.
Throughout this in-depth guide, we have explored the importance of A/B testing and its role in optimizing forms. We have discussed the key components involved in A/B testing, including the control group (A) and variation group (B), as well as the significance of statistical significance and sample size. We have also delved into identifying goals and metrics, determining appropriate metrics to measure and analyze, selecting A/B testing tools, and planning and implementing tests.
Furthermore, we have emphasized the significance of understanding the significance of the winning variation and implementing it effectively on the live website. We have discussed the importance of monitoring post-implementation performance and making iterative improvements based on ongoing data analysis. These steps, when followed diligently, contribute to achieving the desired outcomes and driving continuous optimization.
In addition, we have explored best practices and tips, including the importance of testing one element at a time, running tests for an appropriate duration, considering user segments and behavioral patterns, documenting and sharing test results with stakeholders, and incorporating continuous A/B testing into the optimization process. These practices are essential for maximizing the effectiveness of A/B testing and ensuring its long-term impact on form optimization.
To conclude, it is crucial to recognize that A/B testing should not be viewed as a one-time activity but rather as an ongoing optimization strategy. By continually testing, analyzing, and iterating, businesses can stay ahead of user preferences, improve user experience, and drive higher conversion rates. Embracing A/B testing as an integral part of the optimization process allows for data-driven decision-making and enables businesses to unlock the full potential of their forms.
Incorporating A/B testing as an ongoing practice will empower businesses to continuously optimize their forms, adapt to changing user needs, and ultimately achieve their goals. By implementing the step-by-step process outlined in this guide and leveraging the best practices and tips provided, businesses can embark on a journey of continuous improvement, providing users with seamless form experiences and driving higher conversion rates. So, don’t hesitate—start conducting A/B testing of forms on your web pages today and unlock the potential for enhanced user experience and improved conversion rates.


Leave a Comment